IRSOM2
Tutorial
-
- In FASTA file format with multiple sequences.
- Identifier line of each sequence must start with ">".
- We build a model with coding and ncRNAs coming from a large spectrum of species from different reigns:
- Homo sapiens
- Arabidopsis thaliana
- Drosophila melanogaster
- Escherichia coli
- Danio rerio (zebrafish)
- Mus musculus (mouse)
- Oryza sativa (rice)
- Saccharomyces cerevisiae
- All species
- For each sequence are computed two values: the probability to be a non-coding RNA and the probability to be a coding RNA.
- A prediction is rejected if the difference between the coding and the non-coding probabilities is lower than the rejection threshold.
- The rejection option highlights the transcripts which are between the coding and the ncRNAs.
- Rejection threshold is a value between 0 and 1
- 0 : No rejection
- 1 : Everything is rejected
- By default, the rejection threshold is set to 0.8. This value can be set by the user.
- The rejection threshold is application dependent. For certain applications we may want a high rejection threshold in order to have the most reliable predictions but in an exploratory analysis, we may use a smaller rejection threshold in order to keep more predictions even if they are potentially misclassified.
- Rejection threshold is a value between 0 and 1
- Minimum probability for a sequence to be classified as Bifunctional RNA. If both p(coding) or p(noncoding) is above the minimum probability, the sequence is labelled as Unclassified.
- This option allows to generate a visualisation representing the features weights (ORFs and Codon Bias) for predicted sequences.
- This option allows to perform a search for open reading frames in sequences identified as Bifunctional RNA. It returns the frame and the range of each ORF along with its protein translation.
-
- Please provide coding and noncoding sequences.
- In FASTA file format with multiple sequences.
- Identifier line of each sequence must start with ">".
-
- In FASTA file format as previously.
- For each sequence are computed two values: the probability to be a non-coding RNA and the probability to be a coding RNA.
- A prediction is rejected if the difference between the coding and the non-coding probabilities is lower than the rejection threshold.
- The rejection option highlights the transcripts which are between the coding and the ncRNAs.
- Rejection threshold is a value between 0 and 1
- 0 : No rejection
- 1 : Everything is rejected
- By default, the rejection threshold is set to 0.8. This value can be set by the user.
- The rejection threshold is application dependent. For certain applications we may want a high rejection threshold in order to have the most reliable predictions but in an exploratory analysis, we may use a smaller rejection threshold in order to keep more predictions even if they are potentially misclassified.
- Rejection threshold is a value between 0 and 1
- Minimum probability for a sequence to be classified as Bifunctional RNA. If both p(coding) or p(noncoding) is above the minimum probability, the sequence is labelled as Unclassified.
- This option allows to generate a visualisation representing the features weights (ORFs and Codon Bias) for predicted sequences.
- This option allows to perform a search for open reading frames in sequences identified as Bifunctional RNA. It returns the frame and the range of each ORF along with its protein translation.
- Press CTRL+D on the waiting page to add to your favorites and to access results later.
- In that section are displayed the number and percentage of Noncoding RNA, Coding RNA, Bifunctional RNA and Unclassified sequences.
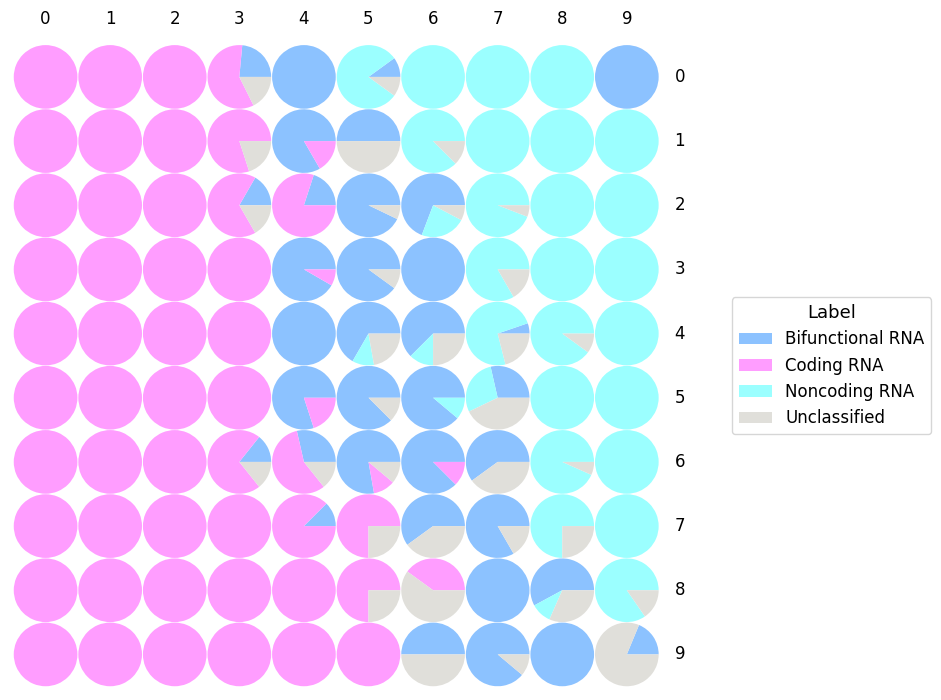
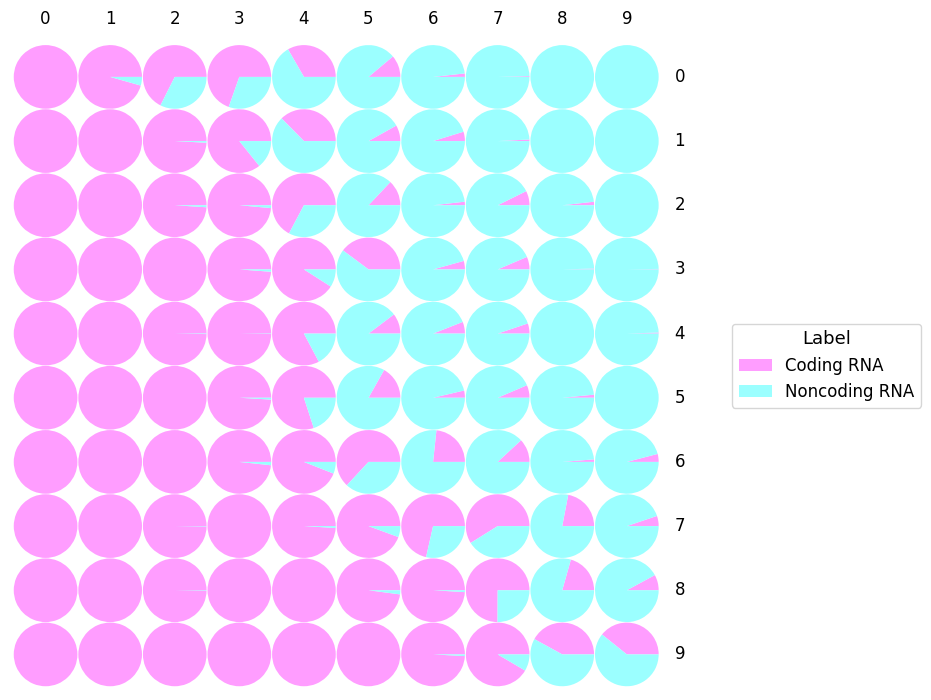
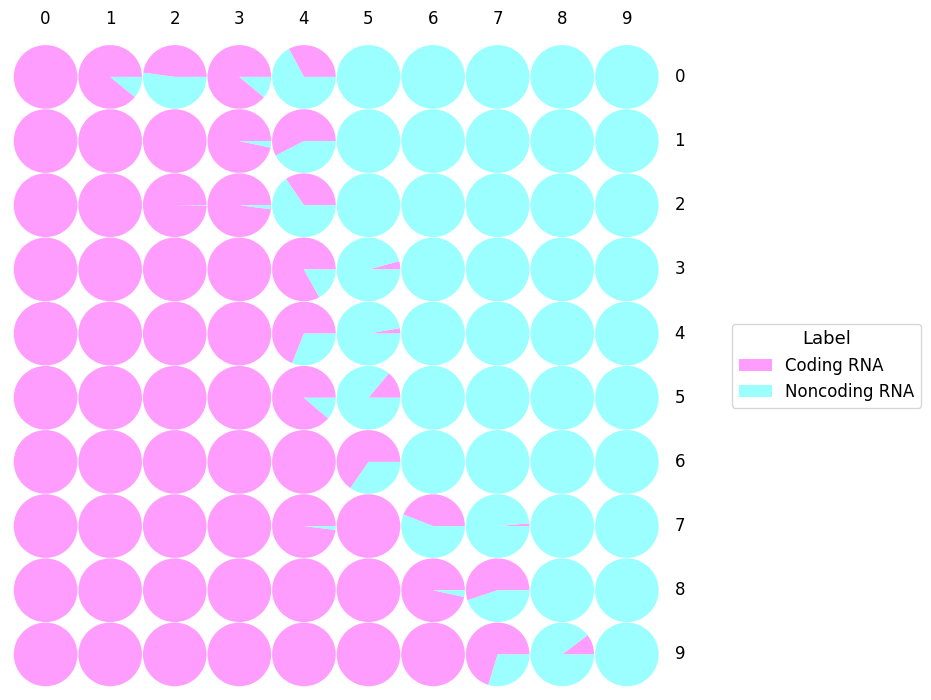
- SOM (Kohonen, 2001) is a neural network that is able to cluster and visualize high dimensional data. By using an unsupervised competitive learning algorithm, SOM is able to produce a map representing the input space.
- Each circle represents the Best Matching Unit (BMU): the neuron which gather RNA sequences sharing similar features.
- In some cases, it could appear some empty areas that refer to BMU without any predicted sequences in it.
- "Label" represents the predicted class of the RNA sequences: Bifunctional RNA, Coding RNA, Noncoding RNA, Unclassified.
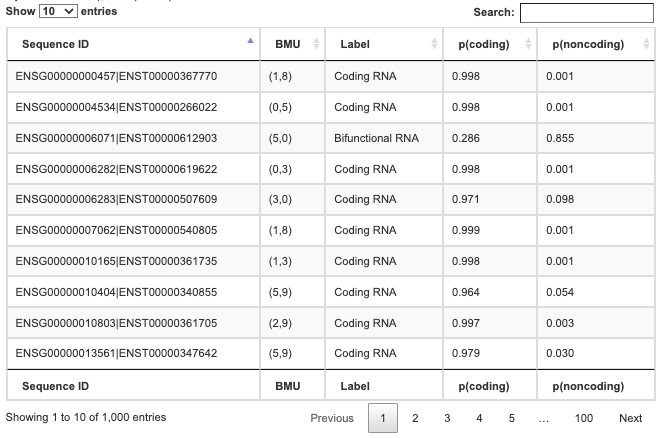
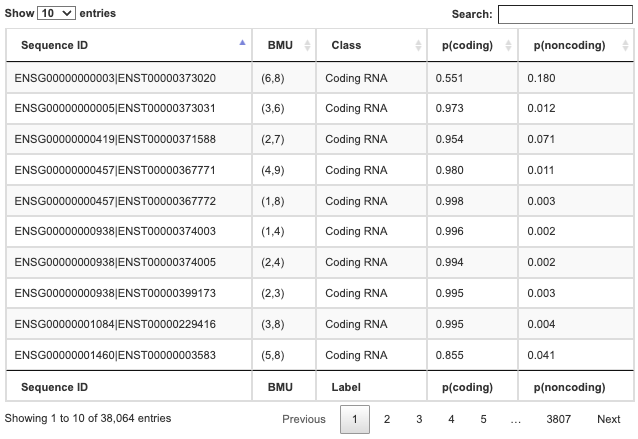
- The table is constituted with the following columns:
- 1. Sequence ID: identifier of the sequence
- 2. BMU (Best Matching Unit) represents the coordinates of the neuron which belong the sequence (see Self-Organizing map)
- 3. Label: predicted class (Coding RNA, Noncoding RNA, Bifunctional RNA or Unclassified)
- 4. Probability of the sequence to be a coding RNA | p(coding)
- 5. Probability of the sequence to be a non-coding RNA | p(noncoding)
- The prediction table is available as a tab-separated text format via the Download button.
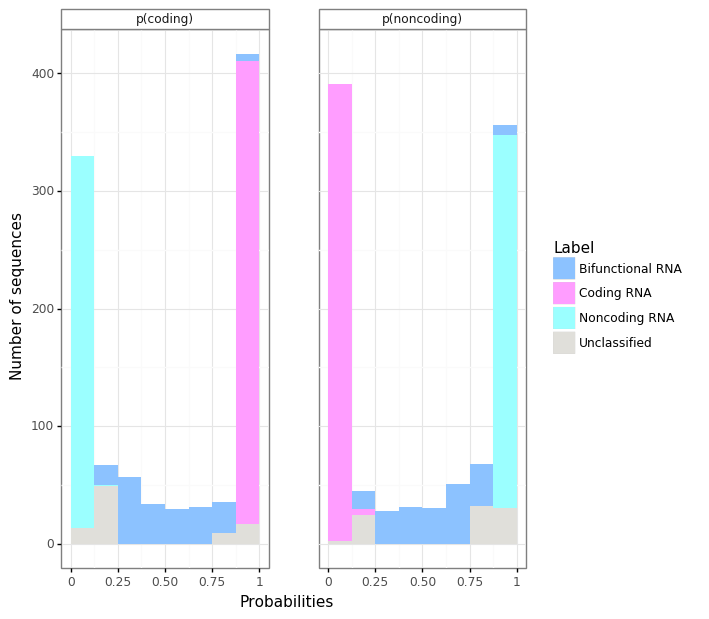
- Barplots show the number of sequences according to:
- On the left: the probability of the sequence to be a coding RNA | p(coding)
- On the right: the probability of the sequence to be a non-coding RNA | p(noncoding)
- Colors refer to the label or predicted class: Bifunctional RNA, Coding RNA, Noncoding RNA, Unclassified.
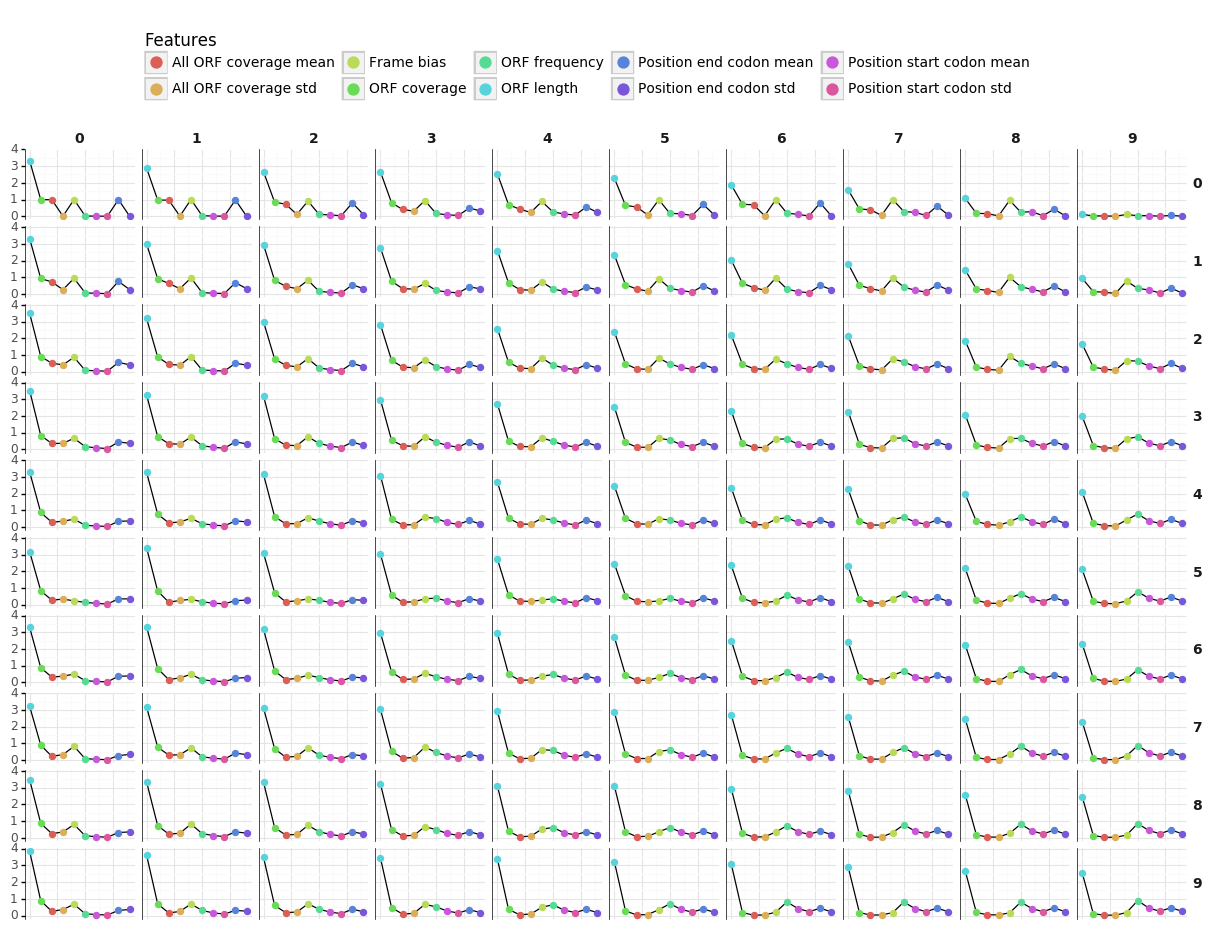
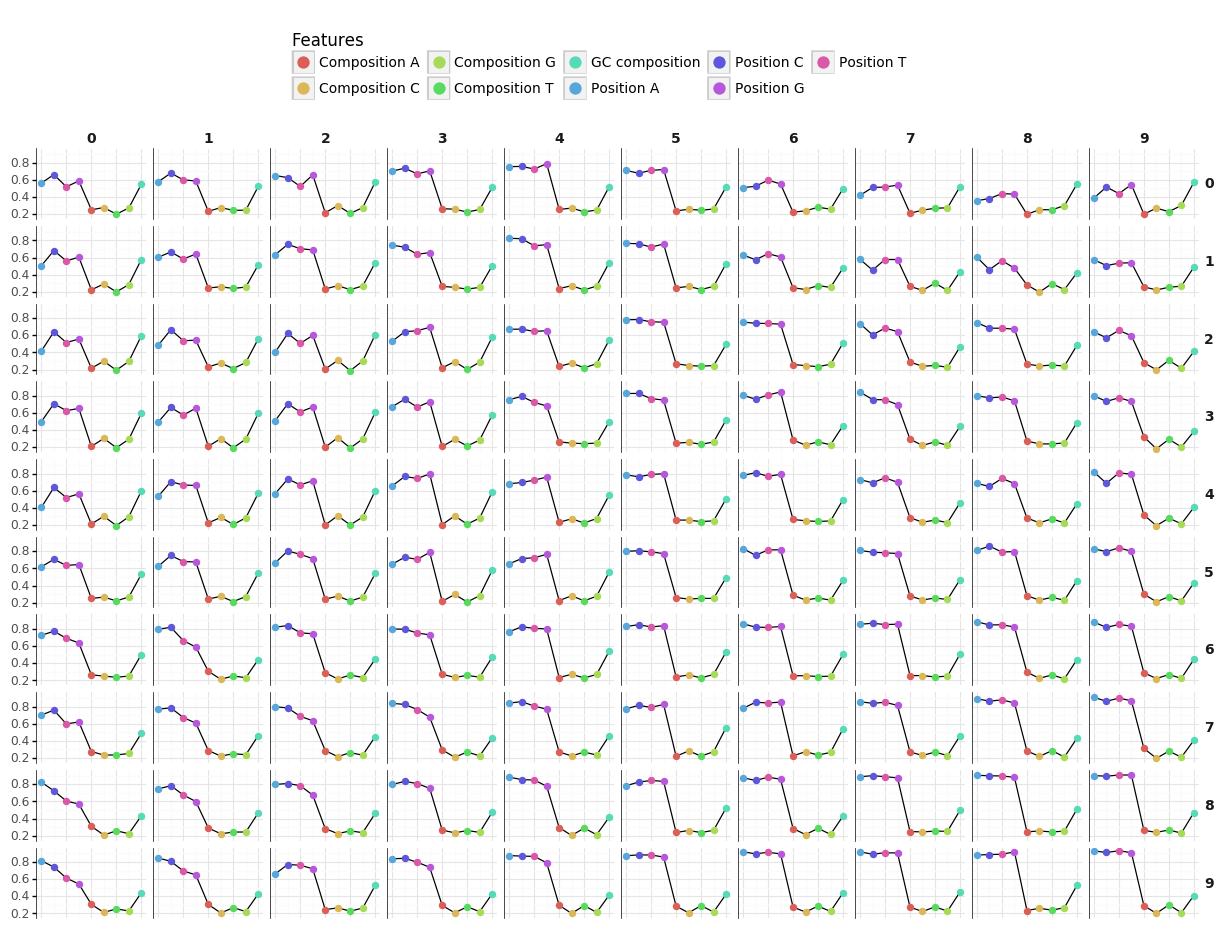
- Features refer to:
- ORF
- Codon bias
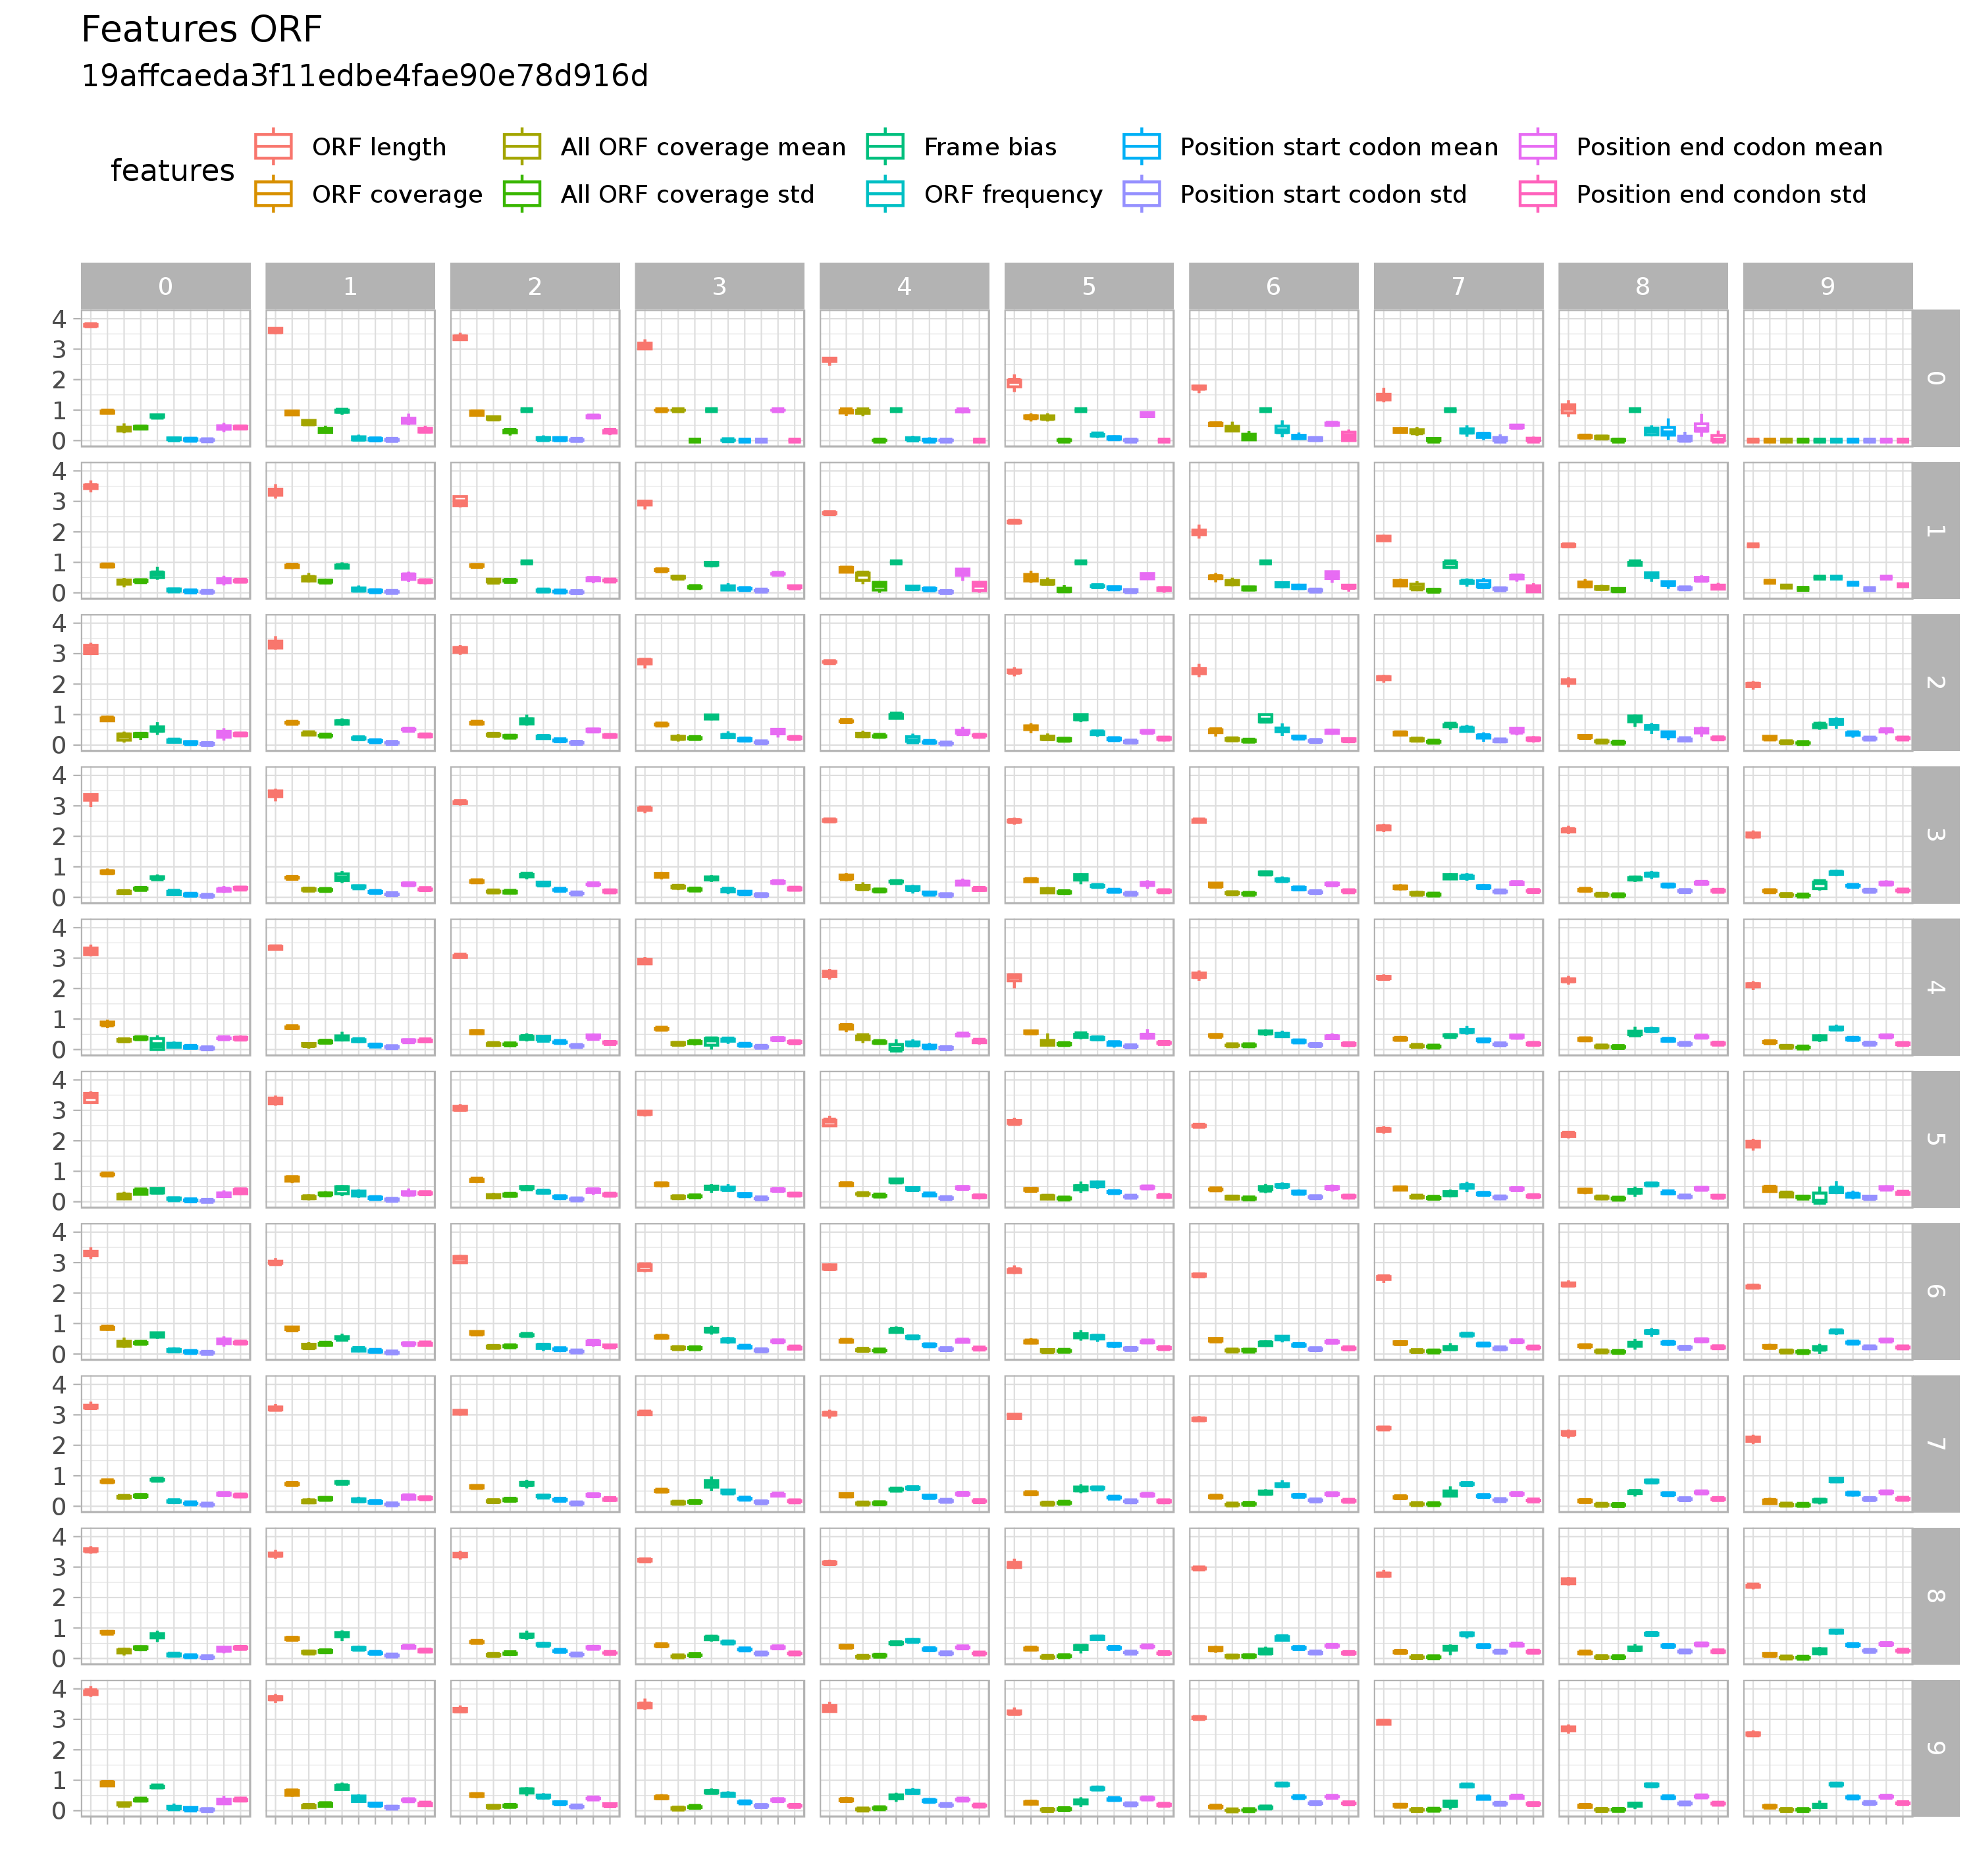
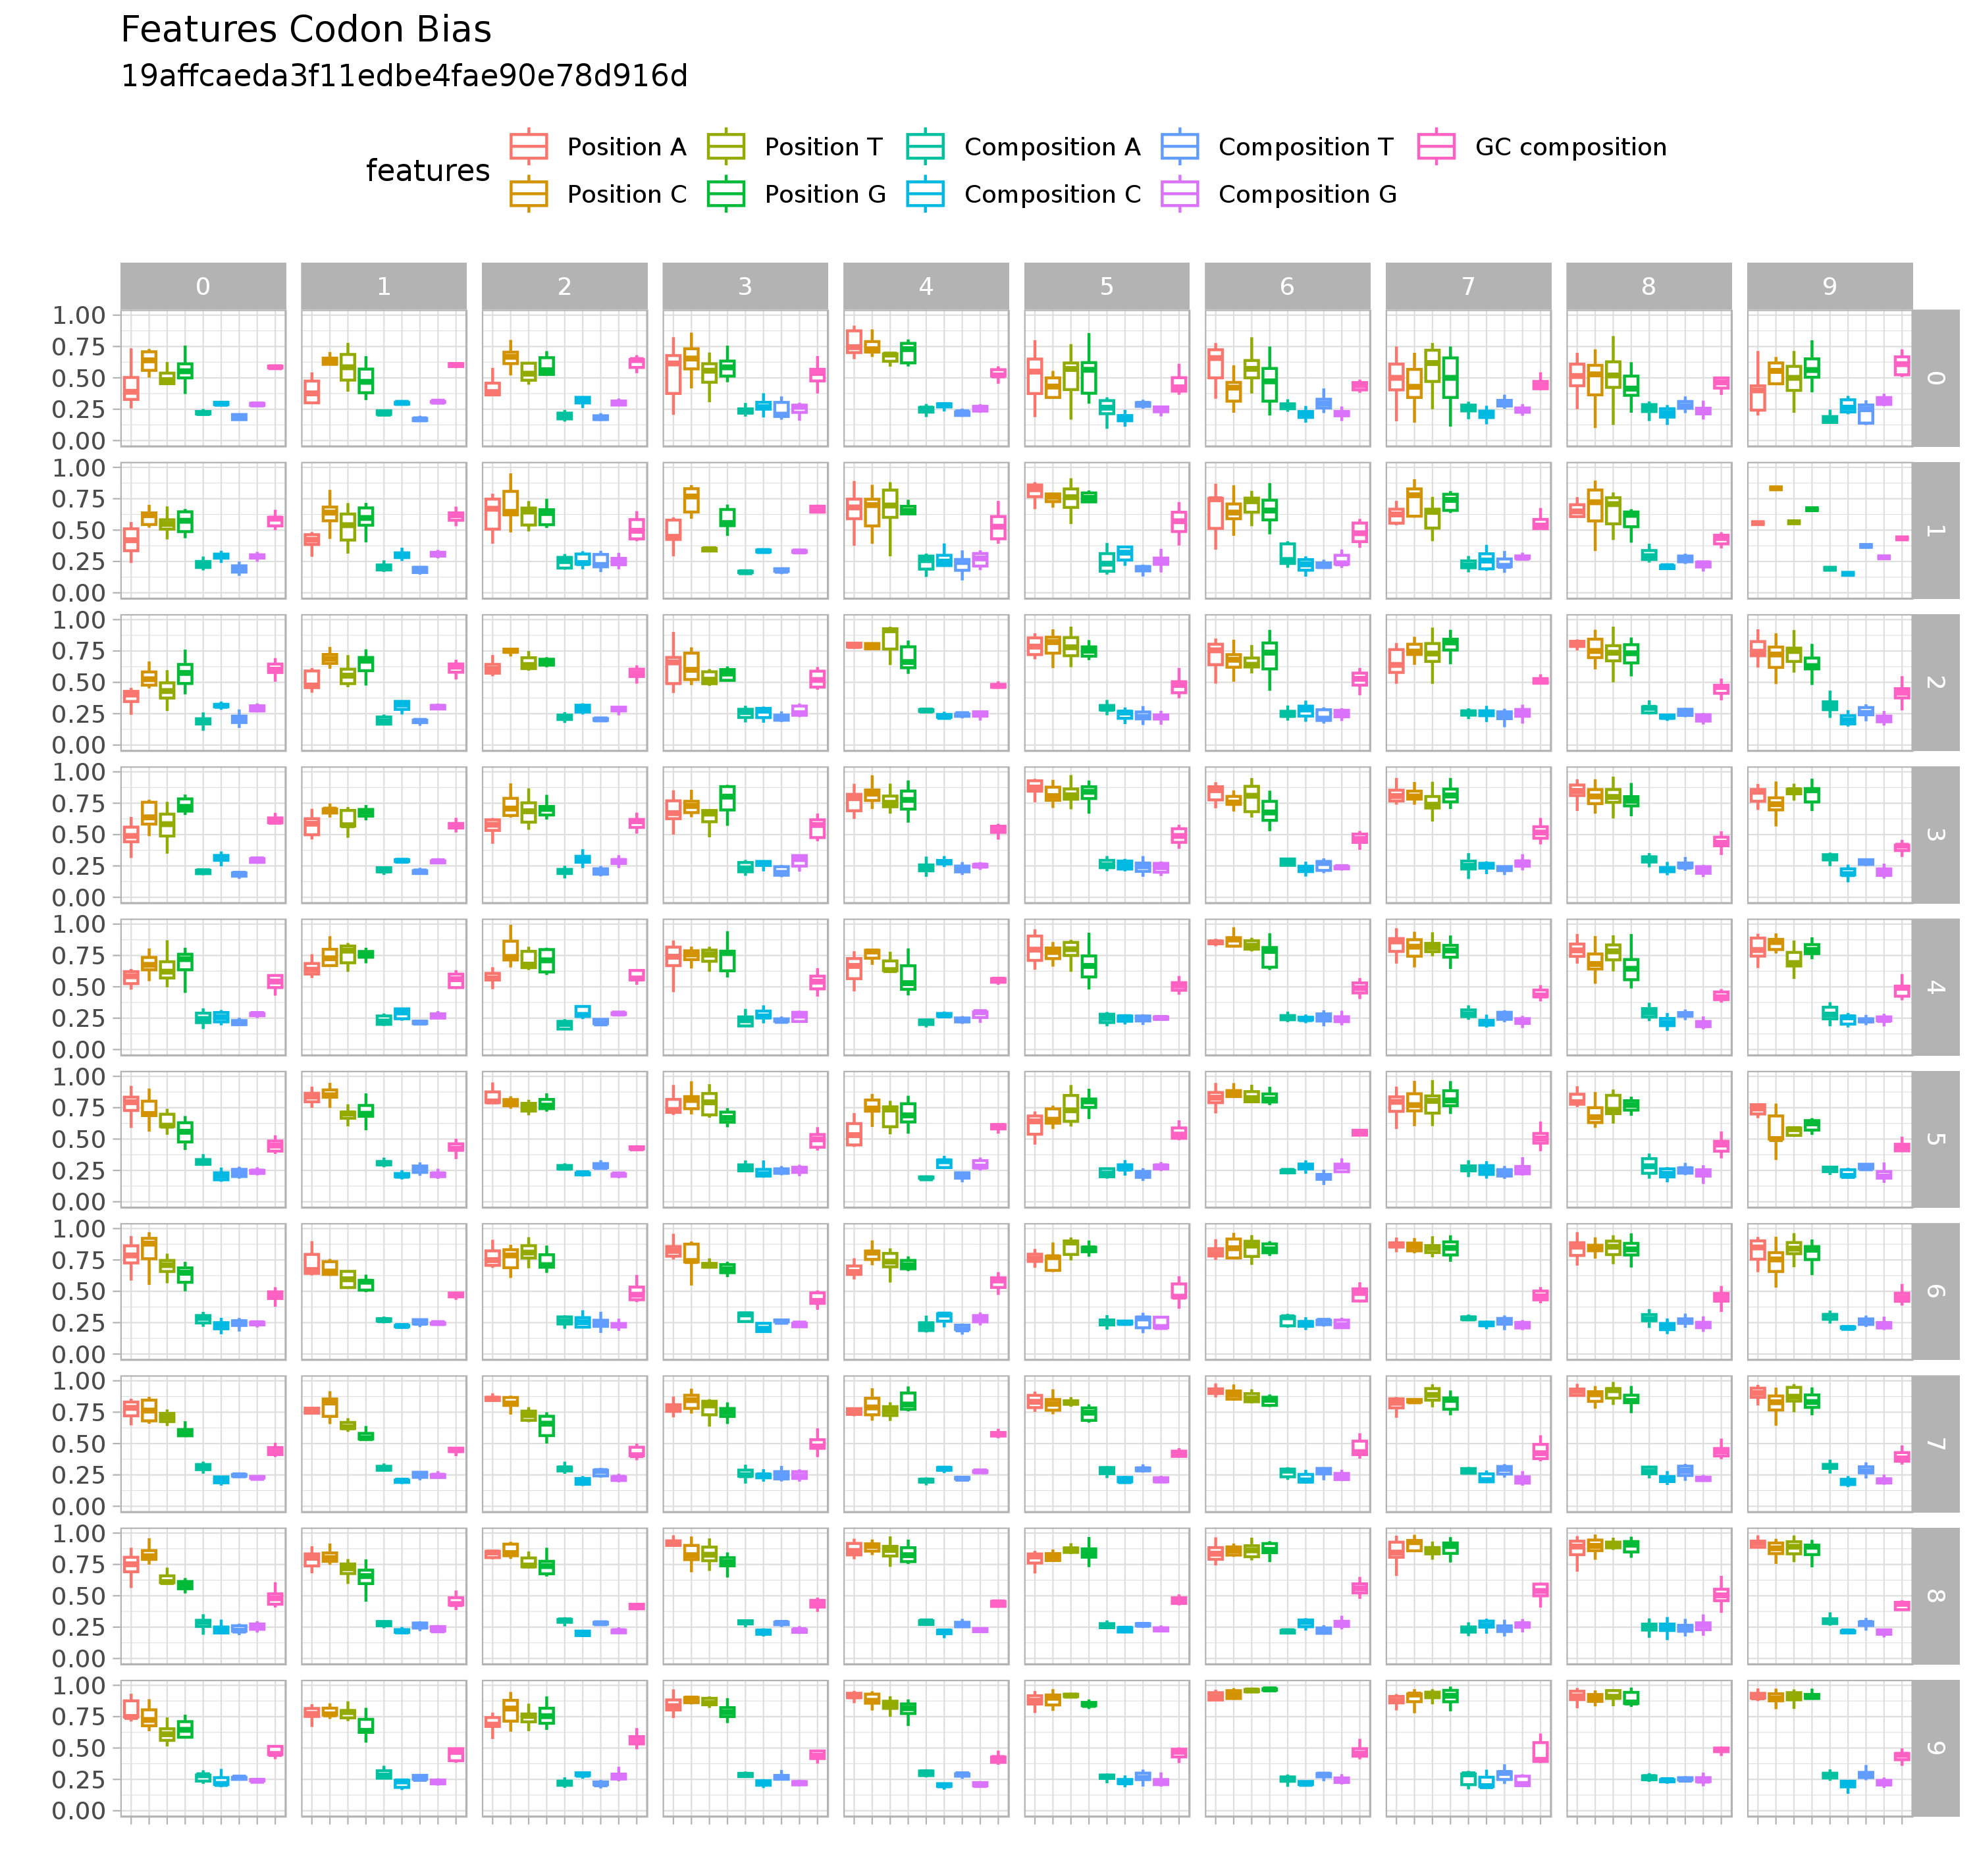
- Two plots showing the profiles of the representatives for each feature are available via the Download buttons.
- Each point in the figure represents the value of the representative for a given feature.
- Our IRSOM algorithm is an alignment-free method based on three types of features which are sequence bias, ORF statistics and k-mer motifs :
- Sequence bias: composed of three features, which are the codon position bias, the frequencies of each nucleotide and the GC frequency. The purpose of the codon position bias is to measure if there is nucleotide position bias in codons.
- Open reading frame (ORF): we compute the length and coverage of the maximal ORF that are useful to access the information of the most probable coding sequence of the transcript.
- k-mer: the k-mers are all the words of size K that are contained in a string. Here, we select the k-mers of size 3, 4 and 5 and compute their frequencies.
- Further information about the features used are available in Platon et al., 2018
- This SOM shows the true label distribution of the model in the hidden layer of IRSOM.
- This SOM shows the predicted label (using training sequences) distribution of the SOM in the hidden layer of IRSOM.
- We measure the classification performance using several measures:
- True positives (TP)
- True negatives (TN)
- False positives (FP)
- False negatives (FN)
- Sensitivity
- Specificity
- Accuracy
- F1 score
- Matthews correlation coefficient (MCC)
- The training table is constituted with the following columns:
- 1. Sequence ID: identifier of the sequence
- 2. BMU (Best Matching Unit) represents the coordinates of the neuron which belong the sequence (see Self-Organizing map)
- 3. Class: true class of the sequence (Coding RNA or Noncoding RNA)
- 4. Probability of the sequence to be a coding RNA | p(coding)
- 5. Probability of the sequence to be a non-coding RNA | p(noncoding)
- The training table is available as a tab-separated text format via the Download button.
For any questions, comments or suggestions about IRSOM, please feel free to contact: fariza.tahi@ibisc.univ-evry.fr